Physiological activation by light of the founding members of the TRP channels superfamily discovered by Minke and colleagues, the Drosophila TRP and TRPL channels, requires the activation of phospholipase C (PLC) enzyme, and possibly the generation of the PLC product diacylglycerol (DAG). This mechanism was extensively studied, yet after many years of research, it is still unclear. Here we re-examined the ability of a DAG analogue to activate the expressed TRPL channels in Human Embryonic Kidney (HEK) cells (see Figure 1). Unlike previous studies, here we applied the DAG analogue to the cytosol via a patch clamp pipette. Strikingly, intracellular application of the DAG analogue robustly activated the expressed TRPL channels. However, TRPL channel activation was much slower than the physiological activation of TRPL channels by light (Figure 2D). Therefore, we used a picosecond-fast optically-activated DAG analogue, OptoDArG. Inactive OptoDArG slowly accumulated in the surface membrane in the dark. Fast application of intense UV light to the recorded cell resulted in a robust TRPL-dependent current (Figure 1A, B) that was greatly accelerated by a constitutively active TRPLF557I pore-region mutation. However, even the measured OptoDArG-activated current (Figure 2A) was >1000-fold slower than the fast (20ms) physiologically-activated TRPL channel by light (Figure 2D), suggesting that DAG alone is not sufficient for TRPL channel activation under physiological conditions.
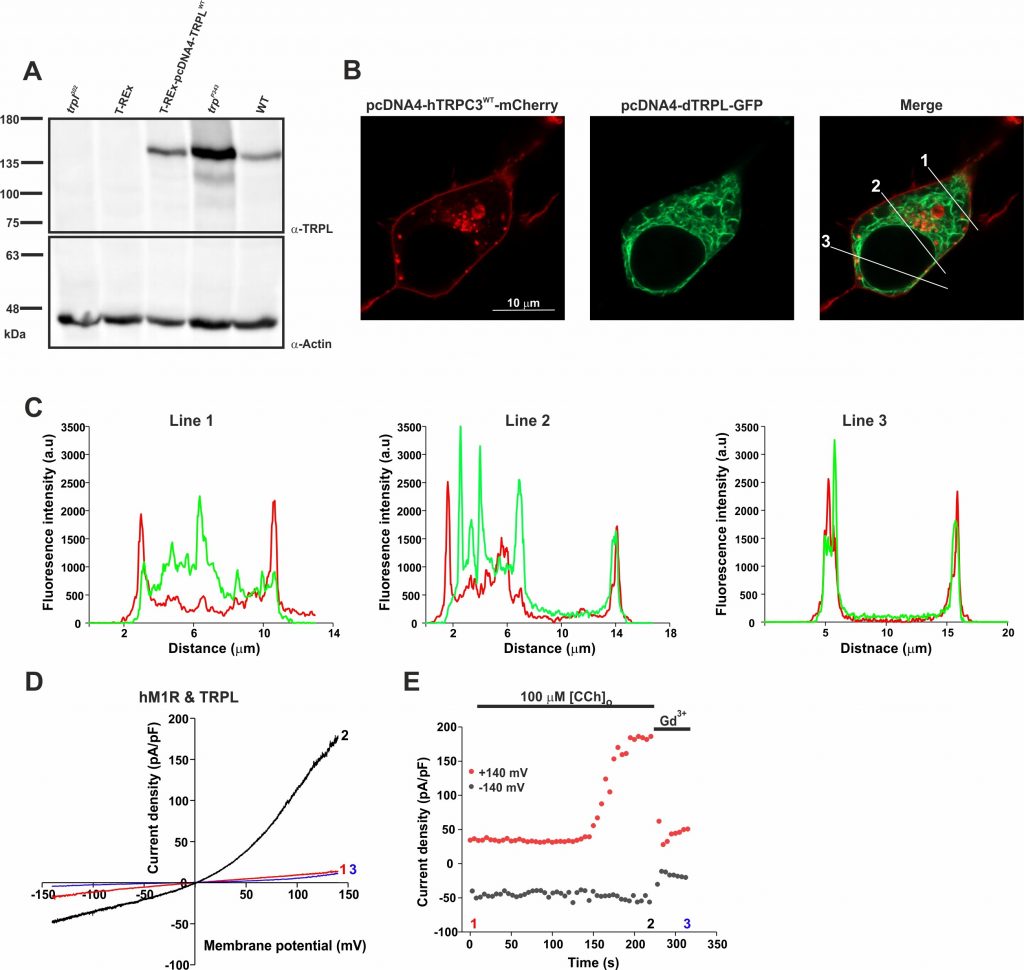
Figure 1. Heterologous expression, localization, and activation of the TRPL channel in HEK cells. (A) Western-blot analysis of T-REx-293 cells expressing dTRPLWT (third lane), using a-dTRPL antibody. Negative controls: i) The Drosophila trpl302 mutant fly heads lacking the TRPL channel (first lane). ii) Un-transfected T-REx cells (second lane). Positive controls: i) The Drosophila trpP343 mutant fly heads expressing only the TRPL channel (fourth lane). ii) The Drosophila WT fly heads (fifth lane). a-Actin antibody was used as protein loading control. Molecular mass marker (in kDa) is indicated to the left of the gel. (B) Representative confocal fluorescence images of Naïve T-REx-293 cells co-transfected with hTRPC3WT-mCherry (red, left) and with dTRPL-GFP (green, middle). The Right image shows the merged localization of hTRPC3WT-mCherry together with dTRPLWT-GFP. Scale bar 10 mm. (C) Line profile graphs of the fluorescent intensity along the three white lines crossing the plasma membrane in the right merged image (1, 2, 3). The red graph represents hTRPC3WT-mCherry expression, and the green graph represents dTRPLWT-GFP expression. (D) Representative current-voltage relationship (i–V curves) obtained from patch clamp whole cell current measurements from a T-REx-293 cell heterologously expressing dTRPLWT, GFP and the human Muscarinic Receptor 1 (hM1R), in response to voltage ramps from -150 mV to +150 mV (in 1s), before bath application of carbachol (CCh, red, 1), after application of 100 mM CCh (black, 2) and after application of the TRPL inhibitor gadolinium (Gd3+, blue). (E) Corresponding currents measured in 5s intervals at +140mV (red) and -140mV (black). Numbers indicate the time of selected i–V curves.
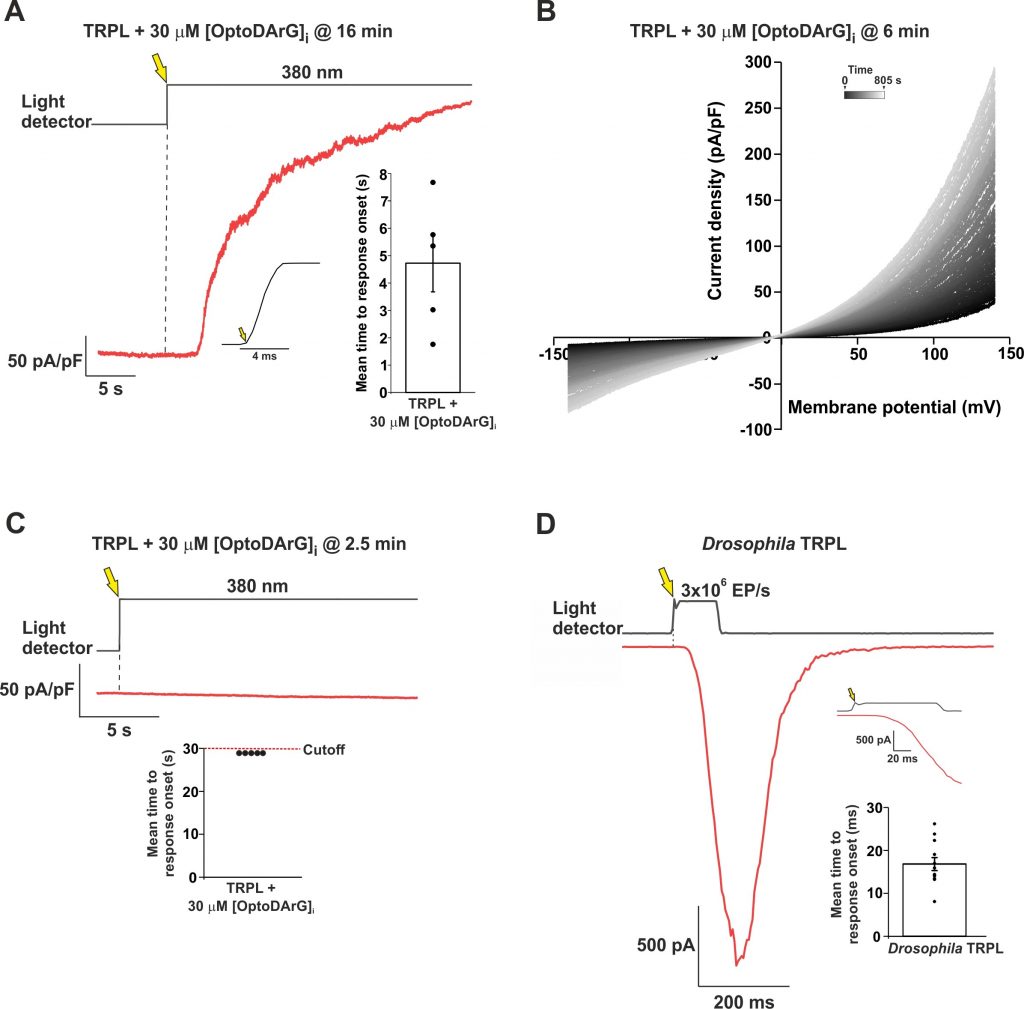
Figure 2. Activation of TRPL channels expressed in HEK cells by an optically controlled DAG analogue in comparison to light activation of Drosophila TRPL. (A) A representative current as a function of time showing an outward current induced by an intense UV (380 nm) light applied to a HEK cell expressing the TRPL channel, in which 30 μM OptoDArG was included in the intracellular solution of the patch clamp pipette. The UV light was applied 16 min after whole cell formation, while the cell was kept in the dark during that time to keep the OptoDArG in its inactive trans configuration. Then, the membrane voltage was increased in the dark from 0 mV to +100 mV holding potential and the UV light was turned on (Light detector, yellow arrow), resulting in a robust outward current (red trace). Left inset, the accurate open time of the electromechanical shutter Right inset, a bar chart showing the mean time to response onset. (B) A cluster of representative i–V curves obtained from patch clamp whole cell current measurements of a T-REx cell expressing TRPL, in response to voltage ramps from -150 mV to +150 mV, following intracellular application of 30 μM OptoDArG for 6 minutes. The first trace (designated 0 seconds in the upper horizontal bar) is in black and indicates the UV 380 nm light onset. The time between each i–V curve was 5 s and the brightening of the trace colors indicates the progression of time during the recordings. (C) Negative control showing negligible current (red) when inactive OptoDArG was not allowed to accumulate in the cell membrane. Inset, a bar chart showing the upper limit of the cutoff time from UV light onset to the termination of the recording. (D) A representative trace showing whole cell current induced by orange light with intensity of 3×10⁶ EP/s (EF, effective photons) of the Drosophila trpP343 mutant photoreceptor (expressing only TRPL channels) in a patch clamp whole cell recording at a holding potential of -70 mV (red). The upper black trace depicts the light measured by the light detector. Top inset, magnified waveform of the light stimulus as measured by the light detector (black) and the initial light induced current (red). Bottom inset, a bar chart showing the mean time to response onset, from the time of light turn-on to the initial TRPL current.