In this paper, we researched the neuronal activity of a deep brain structure called the subthalamic nucleus (STN), which is part of the basal ganglia and is directly involved in Parkinson’s disease (PD). Electrical stimulation of the STN is a major target for Deep Brain Stimulation (DBS) surgery. Therefore, improving our understanding of neuronal dynamics in the STN is crucial for enhancing the efficacy of DBS surgeries.
We collected micro-electrode recordings from over 25,000 sites within the STN of 146 Parkinson’s patients undergoing DBS. The data allowed us to differentiate between the STN’s inputs (local field potentials, or LFP) and outputs (spike discharge rate, or SPK).
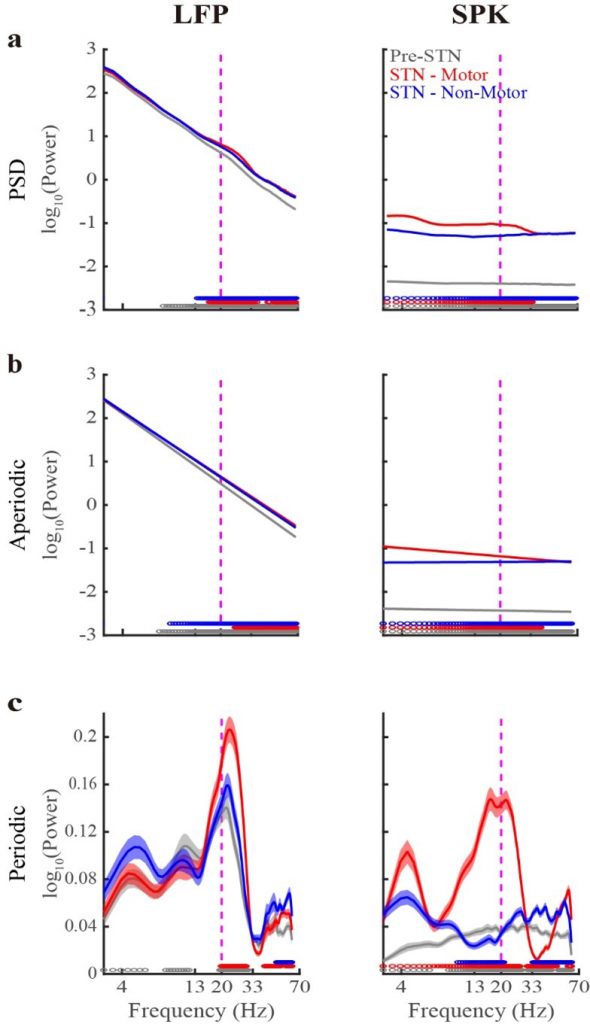
We found that STN activity followed power-law dynamics, a characteristic that is common in many natural systems with self-organized dynamics. In addition, we observed periodic oscillatory components in the beta range. We used the mathematical tool “Fitting Oscillations & One Over F” (FOOOF) to separate the aperiodic from the periodic components in both LFP and SPK activity.
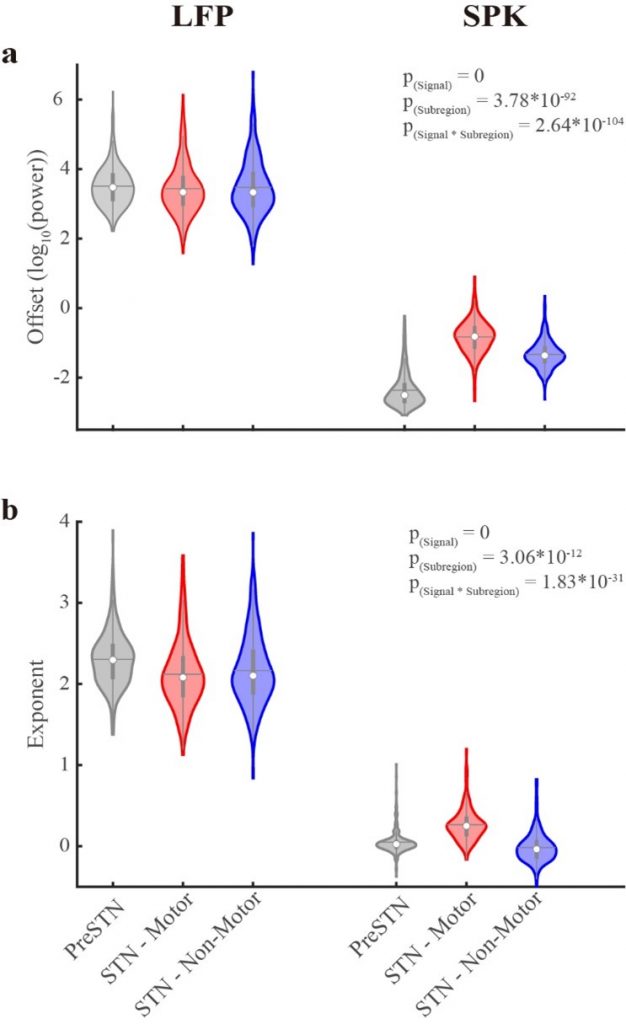
Interestingly, we discovered a noticeable downward shift of the aperiodic exponent and in beta oscillation frequencies in the SPK compared to the LFP, indicating changes in activity between input and output signals. These aperiodic and periodic features of input-output signals are linked to both symptom severity in PD and the therapeutic effects of DBS.
Overall, our findings improve the understanding of the differences and relationships between input and output signals in the STN. This knowledge could help enhance adaptive DBS (aDBS) therapy for PD patients in the future.

Robust differences in aperiodic and periodic components of subthalamic LFP and spiking (SPK) population activity. Left. The population average LFP Power Spectral Density (PSD, a) and its aperiodic (b) and periodic components (c) in three STN sub-regions. Right, same as the left subplot, but for the spiking (SPK) activity. Grey/red/blue lines indicate the pre-STN and STN motor and non-motor domains, respectively. Their corresponding shade lines indicate SEM. Colored circles above the x-axes represent the frequencies at which there was a significant difference between the pre-STN and STN motor domain (grey), between the STN motor and non-motor domains (red), and between the STN non-motor domain and pre-STN (blue). Significance was calculated using the Wilcoxon rank sum test and the Bonferroni correction (p < 0.05/3 = 0.0167). Vertical dashed lines denote the 20 Hz frequency point.

Significant differences in aperiodic parameters of LFP and spiking (SPK) activity in the subregions of the subthalamic nucleus. (a) The aperiodic offset parameter of LFP and SPK in three STN sub-regions. (b) As a, but for the aperiodic exponent parameter. The pre-STN and the STN motor and non-motor domains are shown in gray, red, and blue, respectively. The contour of the violin plots shows the distribution of the data. The white circle shows the median. The horizontal grey line represents the mean. The grey vertical bold lines span from the 25th to the 75th percentiles of the sample, and the length of this line is the interquartile range. The lowest and highest whiskers of the violin plots are values that are 1.5 times the interquartile range below the 25th percentile and above the 75th percentile. The N-way analysis of variance was used to analyze the difference in aperiodic parameters. The P(Signal), P(Subregion), and P(Signal*Subregion) represent the statistical probability for a significant difference in offset or exponent values between LFP and spiking (SPK) activity, for a difference of offset or exponent values between the three STN subregions, and for the interaction effect of offset and exponent values between the signal types and sub-regions.


