Paper of the month

Binshtok's lab: Structural plasticity of axon initial segment in spinal cord neurons underlies inflammatory pain

Yaki Caspi, Michael Mazar, Yishai Kushnir, Yoav Mazor, Ben Katz, Shaya Lev and Alex Binshtok

PAIN ():10.1097/j.pain.0000000000002829, November 29 (2022)

Lay summary:

The structural plasticity of the axon initial segment (AIS), the neuronal site at which synaptic inputs are converted into an action potential (AP) output, is a pivotal mechanism underlying changes in neuronal excitability in various pathological conditions such as type 2 diabetes, Alzheimer’s disease, and stroke. In this paper, Caspi et al. show the first evidence of inflammation-induced AIS plasticity in the central nervous system (CNS) that underlies inflammatory hyperalgesia and pain. Moreover, they demonstrate that in pathological pain, the AIS plasticity-mediated network effect might be different from the expected effect in other neural systems.

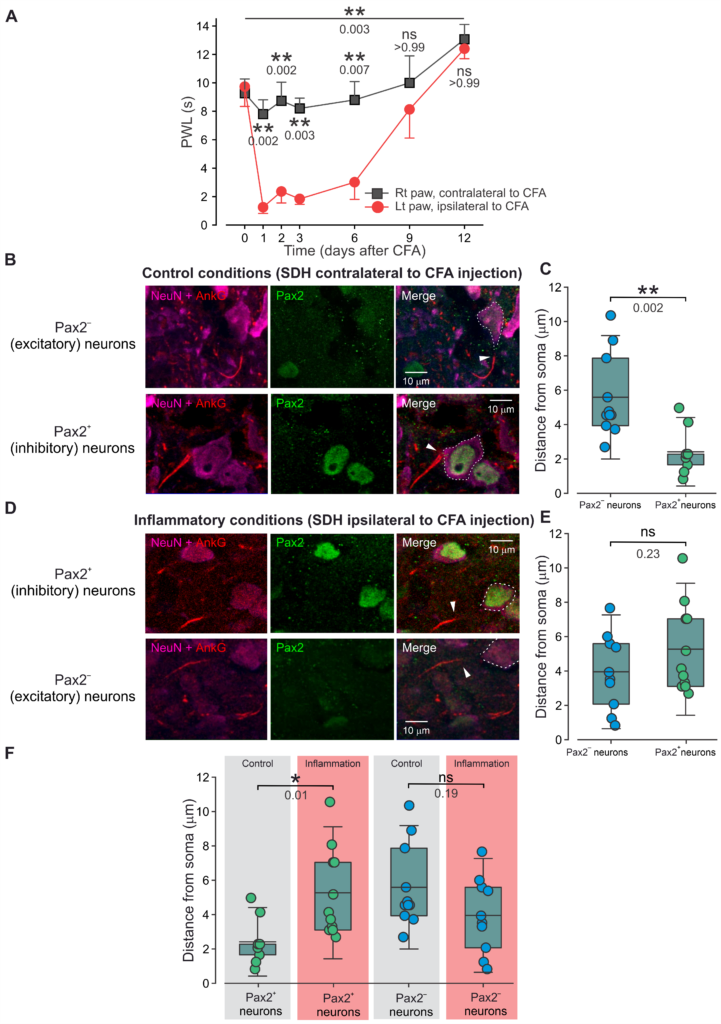
Previous studies showed that the increase in input leads to AIS plasticity, resulting in a decrease in neuronal excitability and a tuning down the network’s output. Caspi et al. show that increased input indeed triggers AIS plasticity and results in a decrease in neuronal excitability. However, since it occurs selectively in the inhibitory neurons, the resulting overall network output would be increased. Overall, their results are striking in that they demonstrate that inflammation-mediated enhanced input from primary nociceptive neurons can trigger differential changes in the intrinsic excitability of CNS neurons, thus tuning the overall neuronal network response to a signal about an ongoing injury. The AIS plasticity, which occurs in a specific neuronal type within the network, provides a novel insight into the effect of this plasticity on network activity.

Figure 1:

Scheme depicting inflammation-induced AIS plasticity in superficial dorsal horn (SDH) spinal cord neurons. Left: In normal conditions, the AIS in the inhibitory SDH neurons is located closer to the soma than in excitatory neurons. The proximal location of AIS confers upon SDH inhibitory neurons a small threshold current, suggesting that they will be more prone to activation by the same input than excitatory neurons will be. This increased intrinsic excitability, together with their amplified “tonic” output, balances the activity of excitatory delayed firing neurons, even though inhibitory neurons constitute only 30% of SDH neurons. Right: Inflammation induces a distal shift in AIS in inhibitory, but not excitatory, SDH neurons. The distancing of the AIS from the soma in inhibitory neurons increases the threshold current, which by decreasing their intrinsic excitability, disrupts the excitatory-inhibitory SDH equilibrium, thus rendering the SDH circuitry hyperactive. Blue dots, excitatory neurons; green dots, inhibitory neurons; dot size depicts the level of excitability of the neuron.

Figure 2:

AIS in inhibitory but not excitatory superficial dorsal horn (SDH) spinal neurons shifts distally from the soma in inflammatory conditions. A. Changes in paw withdrawal latency (PWL) following proinflammatory agent CFA injection into the left paw, measured in the left (ipsilateral) and right (contralateral) paws. Timepoint “0” depicts the baseline measurements before CFA injection. n = 7 rats, ordinary two-way ANOVA with post hoc Bonferroni test. B. Representative confocal images of Pax2− excitatory cells (upper) and Pax2+ inhibitory cells (lower). The arrow indicates the beginning of AIS based on the AnkG staining. C. Box plots and individual values of the distances of AIS from the soma measured in excitatory Pax2− and inhibitory Pax2+ neurons in control conditions. Each data point represents individual neurons. Statistics calculated using Student’s t-test. D. Same as in B but showing representative excitatory Pax2− and inhibitory Pax2+ neurons in inflammatory conditions. E. Box plots and individual values of the distances of AIS from the soma measured in Pax2− and Pax2+ neurons in inflammatory conditions. Statistics calculated using Student’s t-test. F. Data shown in C and E rearranged to compare the distances of AIS from the soma in Pax2+ and Pax2− neurons between control (contralateral, grey) and inflammatory (ipsilateral, light red) conditions. Statistics calculated using ordinary one-way ANOVA with post hoc Bonferroni test.

“Working memory”